【GIS开发】Leaflet入门学习(Javascript库)_leaflet.js教程-程序员宅基地
技术标签: GIS gis webgis js leaflet map
JavaScript library for mobile-friendly interactive maps
1、简介
https://github.com/Leaflet/Leaflet
https://leafletjs.com/SlavaUkraini/index.html

Leaflet.js是一个开源库,使用它我们可以部署简单,交互式,轻量级的Web地图。
-
Leaflet JavaScript库允许您使用图层,WMS,标记,弹出窗口,矢量图层(折线,多边形,圆形等),图像叠加层和GeoJSON等图层。
-
您可以通过拖动地图,缩放(通过双击或滚轮滚动),使用键盘,使用事件处理以及拖动标记来与Leaflet地图进行交互。
-
Leaflet支持浏览器,如桌面上的Chrome,Firefox,Safari 5 +,Opera 12 +,IE 7-11,以及Safari,Android,Chrome,Firefox等手机浏览器。
2、快速入门
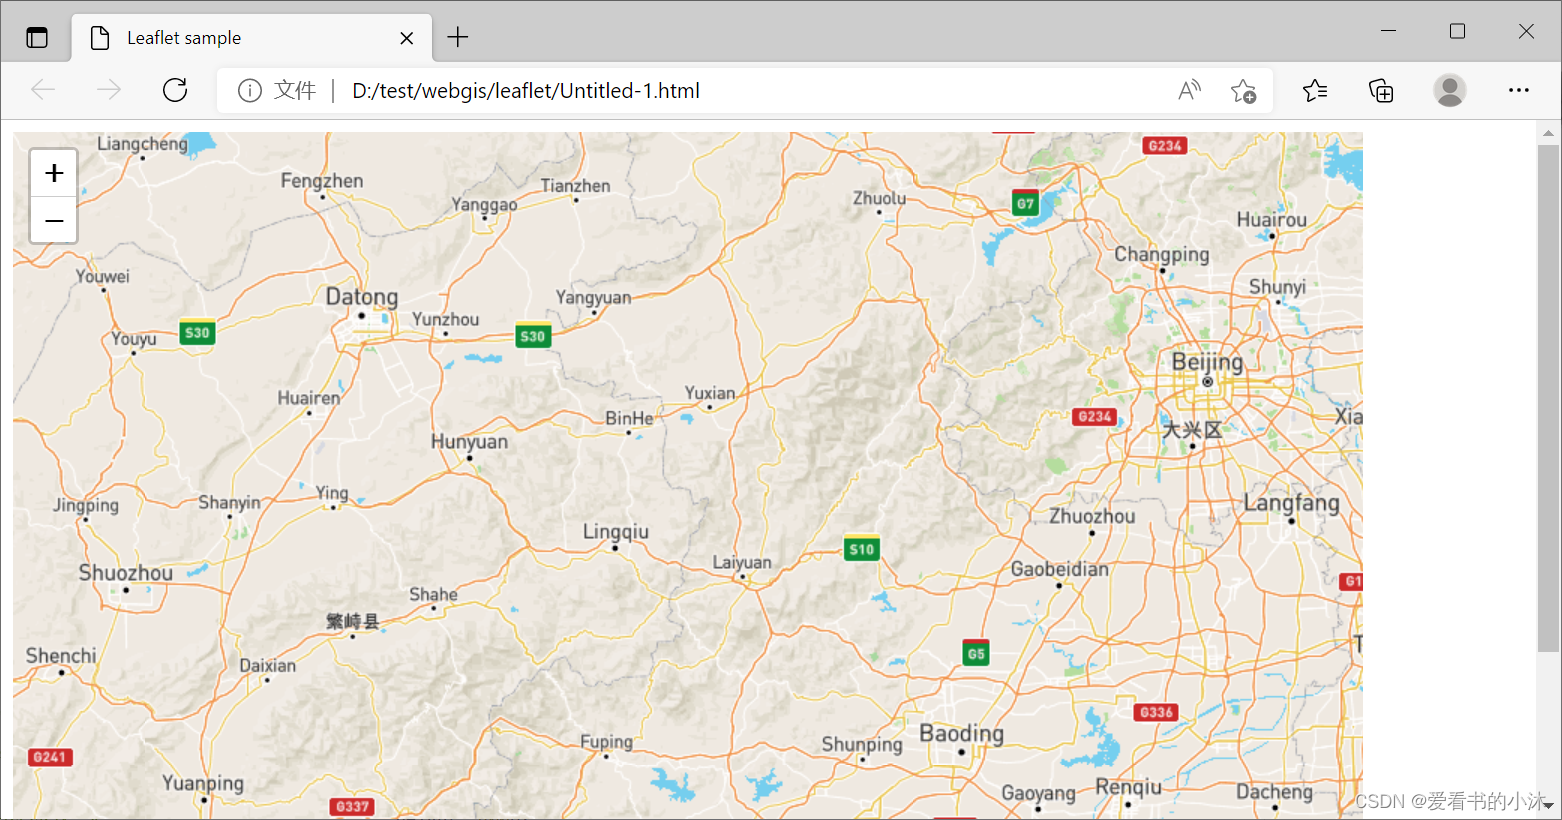
- 例子1:
<!DOCTYPE html>
<html>
<head>
<title>Leaflet sample</title>
<link rel="stylesheet" href="https://unpkg.com/[email protected]/dist/leaflet.css"
integrity="sha512-xodZBNTC5n17Xt2atTPuE1HxjVMSvLVW9ocqUKLsCC5CXdbqCmblAshOMAS6/keqq/sMZMZ19scR4PsZChSR7A=="
crossorigin="" />
<script src="https://unpkg.com/[email protected]/dist/leaflet.js"
integrity="sha512-XQoYMqMTK8LvdxXYG3nZ448hOEQiglfqkJs1NOQV44cWnUrBc8PkAOcXy20w0vlaXaVUearIOBhiXZ5V3ynxwA=="
crossorigin=""></script>
</head>
<body>
<div id="map" style="width: 900px; height: 580px"></div>
<script>
// Creating map options
var mapOptions = {
center: [39.385044, 114.486671],
zoom: 8
}
// Creating a map object
var map = new L.map('map', mapOptions);
// Creating a Layer object
//var layer = new L.TileLayer('http://{s}.tile.openstreetmap.org/{z}/{x}/{y}.png');
// Adding layer to the map
//map.addLayer(layer);
var tiles = L.tileLayer(
'https://api.mapbox.com/styles/v1/{id}/tiles/{z}/{x}/{y}?access_token=pk.eyJ1IjoibWFwYm94IiwiYSI6ImNpejY4NXVycTA2emYycXBndHRqcmZ3N3gifQ.rJcFIG214AriISLbB6B5aw', {
maxZoom: 18,
attribution: 'Map data © <a href="https://www.openstreetmap.org/copyright">OpenStreetMap</a> contributors, ' +
'Imagery <a href="https://www.mapbox.com/">Mapbox</a>',
id: 'mapbox/streets-v11',
tileSize: 512,
zoomOffset: -1
}).addTo(map);
</script>
</body>
</html>
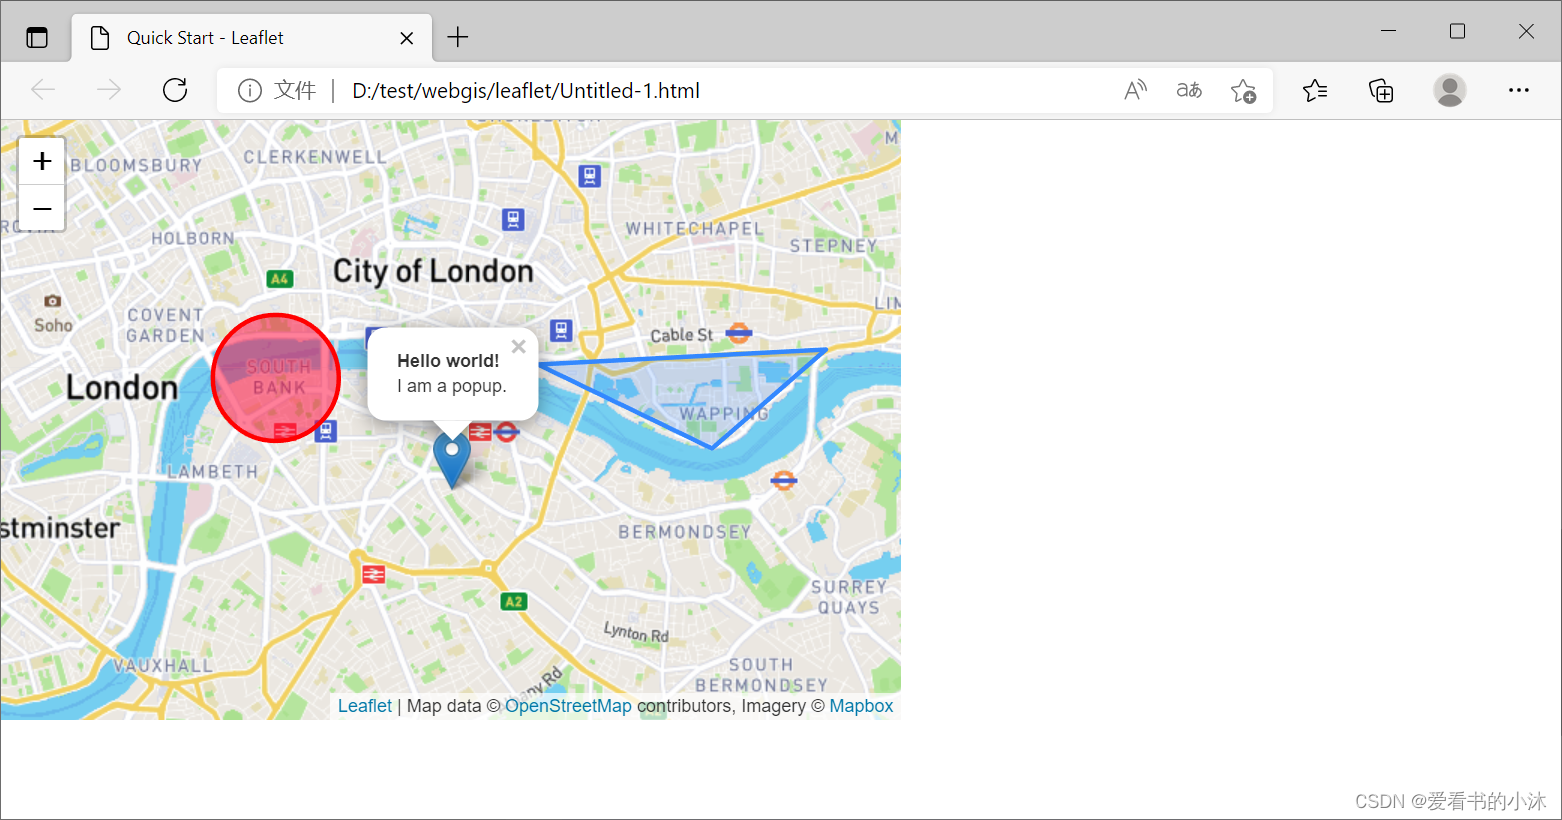
- 例子2:
<!DOCTYPE html>
<html lang="en">
<head>
<title>Quick Start - Leaflet</title>
<meta charset="utf-8" />
<meta name="viewport" content="width=device-width, initial-scale=1.0">
<link rel="shortcut icon" type="image/x-icon" href="docs/images/favicon.ico" />
<link rel="stylesheet" href="https://unpkg.com/[email protected]/dist/leaflet.css" integrity="sha512-xodZBNTC5n17Xt2atTPuE1HxjVMSvLVW9ocqUKLsCC5CXdbqCmblAshOMAS6/keqq/sMZMZ19scR4PsZChSR7A==" crossorigin=""/>
<script src="https://unpkg.com/[email protected]/dist/leaflet.js" integrity="sha512-XQoYMqMTK8LvdxXYG3nZ448hOEQiglfqkJs1NOQV44cWnUrBc8PkAOcXy20w0vlaXaVUearIOBhiXZ5V3ynxwA==" crossorigin=""></script>
<style>
html, body {
height: 100%;
margin: 0;
}
.leaflet-container {
height: 400px;
width: 600px;
max-width: 100%;
max-height: 100%;
}
</style>
</head>
<body>
<div id="map" style="width: 600px; height: 400px;"></div>
<script>
var map = L.map('map').setView([51.505, -0.09], 13);
var tiles = L.tileLayer('https://api.mapbox.com/styles/v1/{id}/tiles/{z}/{x}/{y}?access_token=pk.eyJ1IjoibWFwYm94IiwiYSI6ImNpejY4NXVycTA2emYycXBndHRqcmZ3N3gifQ.rJcFIG214AriISLbB6B5aw', {
maxZoom: 18,
attribution: 'Map data © <a href="https://www.openstreetmap.org/copyright">OpenStreetMap</a> contributors, ' +
'Imagery <a href="https://www.mapbox.com/">Mapbox</a>',
id: 'mapbox/streets-v11',
tileSize: 512,
zoomOffset: -1
}).addTo(map);
var marker = L.marker([51.5, -0.09]).addTo(map)
.bindPopup('<b>Hello world!</b><br />I am a popup.').openPopup();
var circle = L.circle([51.508, -0.11], {
color: 'red',
fillColor: '#f03',
fillOpacity: 0.5,
radius: 500
}).addTo(map).bindPopup('I am a circle.');
var polygon = L.polygon([
[51.509, -0.08],
[51.503, -0.06],
[51.51, -0.047]
]).addTo(map).bindPopup('I am a polygon.');
var popup = L.popup()
.setLatLng([51.513, -0.09])
.setContent('I am a standalone popup.')
.openOn(map);
function onMapClick(e) {
popup
.setLatLng(e.latlng)
.setContent('You clicked the map at ' + e.latlng.toString())
.openOn(map);
}
map.on('click', onMapClick);
</script>
</body>
</html>
可以加载各种服务提供商的层,比如Open Topo,Thunder forest,Hydda,ESRI,Open weather,NASA GIBS等。
| 地图类型 | 地图提供商 |
|---|---|
| Mapnik | http://{s}.tile.openstreetmap.org/{z}/{x}/{y}.png |
| Black And White,黑白地图 | http://{s}.tiles.wmflabs.org/bw-mapnik/{z}/{x}/{y}.png |
| DE | http://{s}.tile.openstreetmap.de/tiles/osmde/{z}/{x}/ {y}.png |
| France | http://{s}.tile.openstreetmap.fr/osmfr/{z}/{x}/{y}.png |
| Hot | http://{s}.tile.openstreetmap.fr/hot/{z}/{x}/{y}.png |
| BZH | http://tile.openstreetmap.bzh/br/{z}/{x}/{y}.png |
3、基础功能
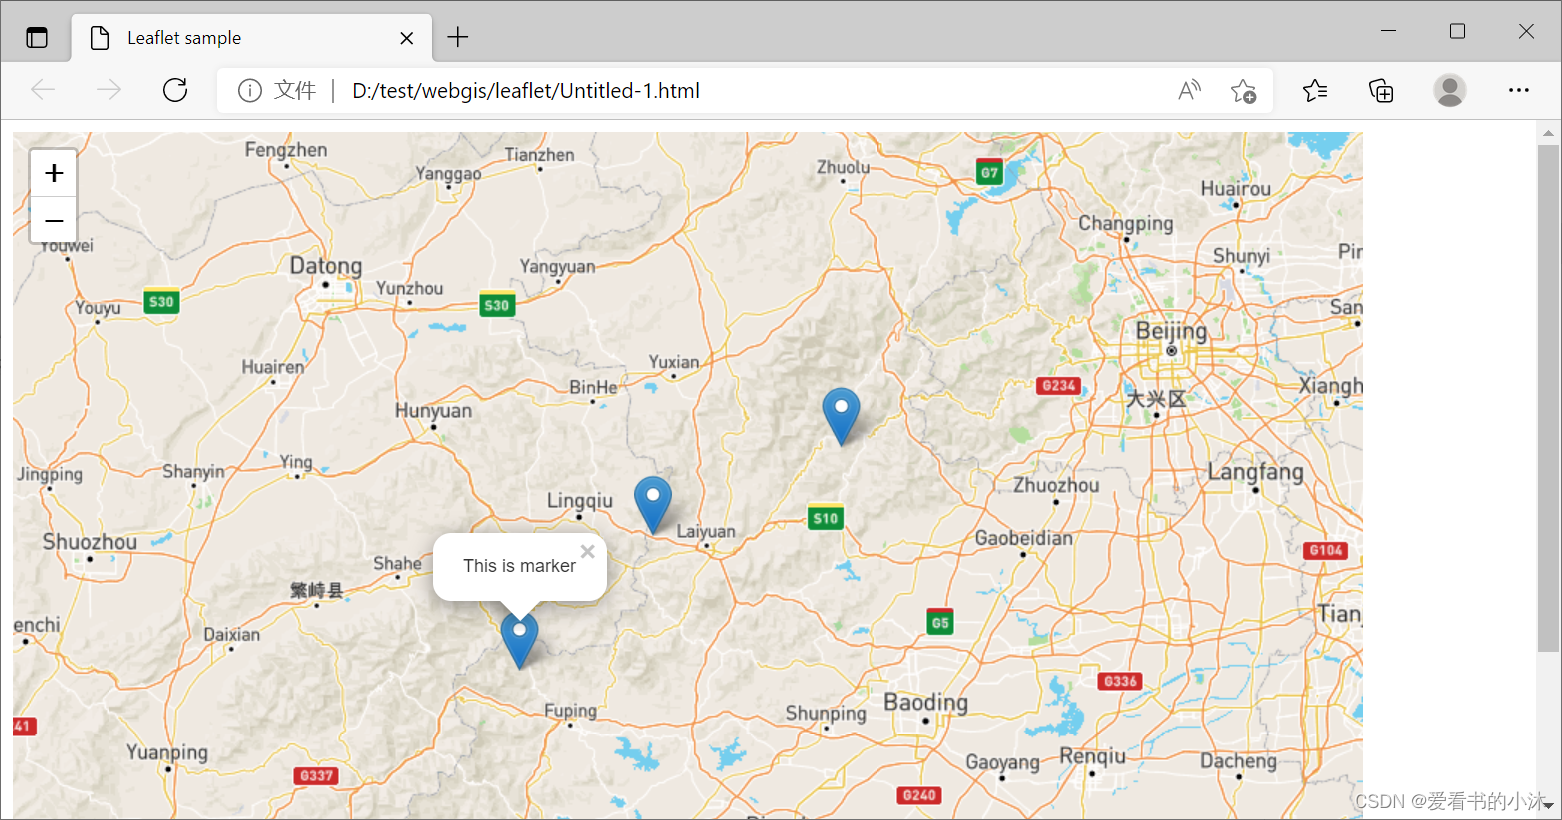
3.1 标记( Markers)
<!DOCTYPE html>
<html>
<head>
<title>Leaflet sample</title>
<link rel="stylesheet" href="https://unpkg.com/[email protected]/dist/leaflet.css"
integrity="sha512-xodZBNTC5n17Xt2atTPuE1HxjVMSvLVW9ocqUKLsCC5CXdbqCmblAshOMAS6/keqq/sMZMZ19scR4PsZChSR7A=="
crossorigin="" />
<script src="https://unpkg.com/[email protected]/dist/leaflet.js"
integrity="sha512-XQoYMqMTK8LvdxXYG3nZ448hOEQiglfqkJs1NOQV44cWnUrBc8PkAOcXy20w0vlaXaVUearIOBhiXZ5V3ynxwA=="
crossorigin=""></script>
</head>
<body>
<div id="map" style="width: 900px; height: 580px"></div>
<script>
// Creating map options
var mapOptions = {
center: [39.385044, 114.486671],
zoom: 8
}
// Creating a map object
var map = new L.map('map', mapOptions);
// Creating a Layer object
var tiles = L.tileLayer(
'https://api.mapbox.com/styles/v1/{id}/tiles/{z}/{x}/{y}?access_token=pk.eyJ1IjoibWFwYm94IiwiYSI6ImNpejY4NXVycTA2emYycXBndHRqcmZ3N3gifQ.rJcFIG214AriISLbB6B5aw', {
maxZoom: 18,
attribution: 'Map data © <a href="https://www.openstreetmap.org/copyright">OpenStreetMap</a> contributors, ' +
'Imagery <a href="https://www.mapbox.com/">Mapbox</a>',
id: 'mapbox/streets-v11',
tileSize: 512,
zoomOffset: -1
}).addTo(map);
// Creating a marker1
var marker = L.marker([39.385044, 114.486671]);
// Adding marker to the map
marker.addTo(map);
// Creating a marker2
var marker2 = L.marker([39, 114]);
// Adding marker to the map
// Adding popup to the marker
marker2.bindPopup('This is marker').openPopup();
marker2.addTo(map);
// Creating a marker3
var markerOptions = {
title: "MyLocation",
clickable: true,
draggable: true
}
var marker3 = L.marker([39.5, 115], markerOptions);
// Adding marker to the map
marker3.addTo(map);
</script>
</body>
</html>
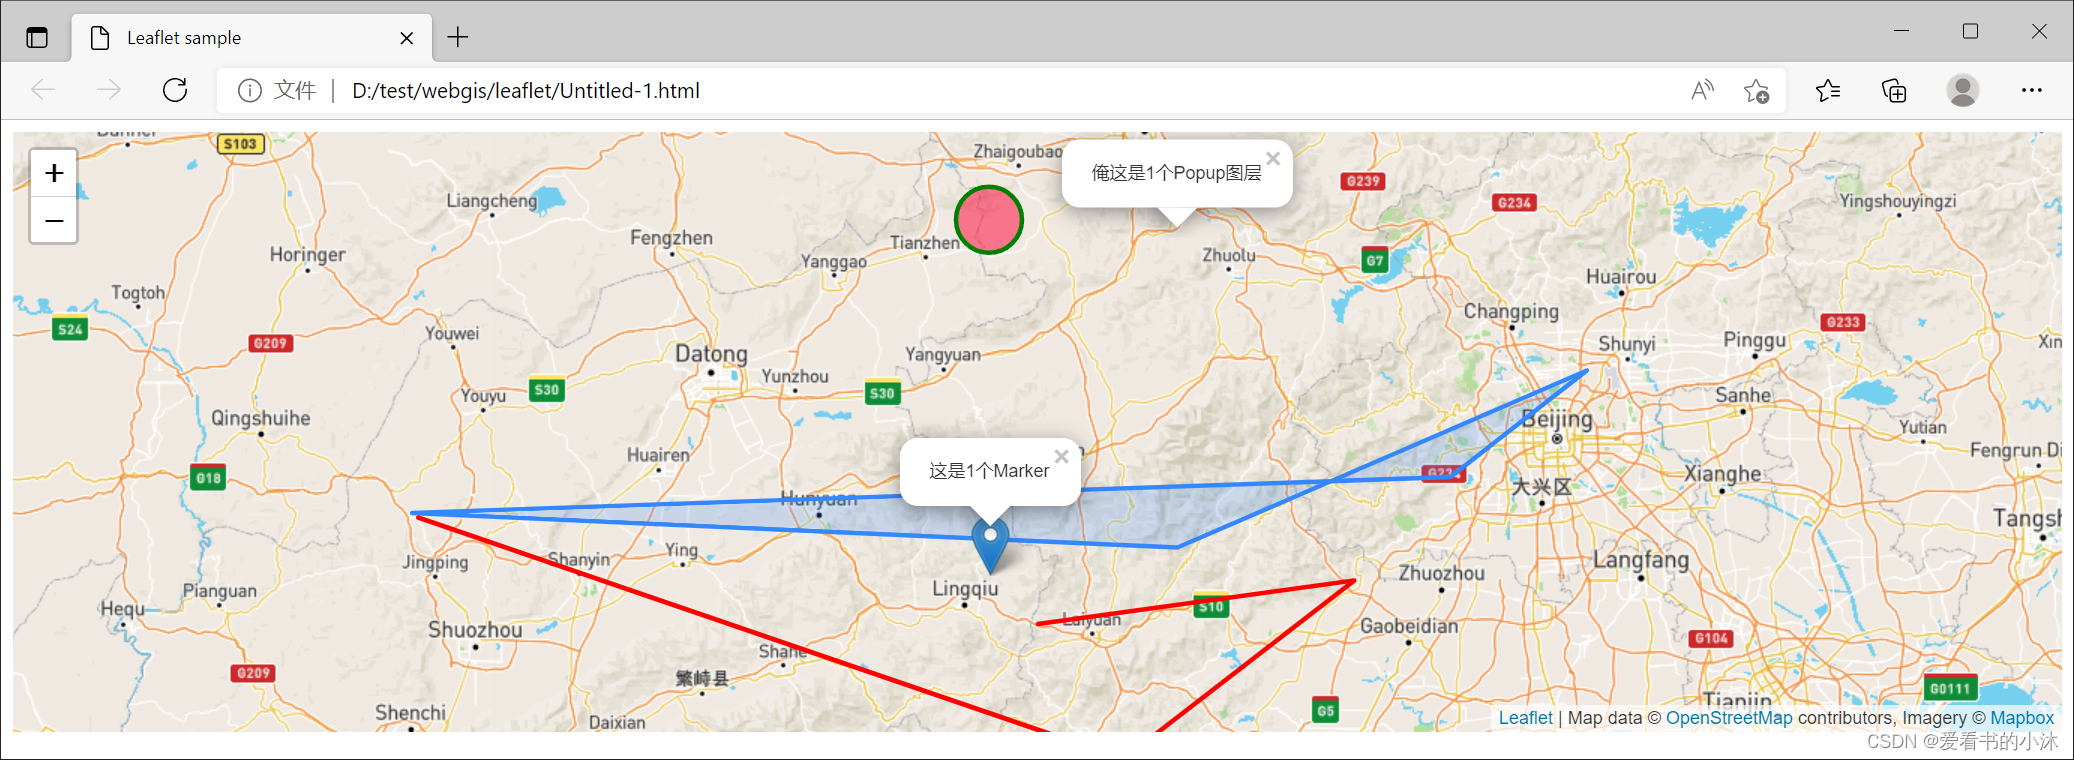
3.2 矢量图层( Vector Layers)
要使用Leaflet JavaScript库在地图上绘制折线叠加层。
<!DOCTYPE html>
<html>
<head>
<title>Leaflet sample</title>
<link rel="stylesheet" href="https://unpkg.com/[email protected]/dist/leaflet.css"
integrity="sha512-xodZBNTC5n17Xt2atTPuE1HxjVMSvLVW9ocqUKLsCC5CXdbqCmblAshOMAS6/keqq/sMZMZ19scR4PsZChSR7A=="
crossorigin="" />
<script src="https://unpkg.com/[email protected]/dist/leaflet.js"
integrity="sha512-XQoYMqMTK8LvdxXYG3nZ448hOEQiglfqkJs1NOQV44cWnUrBc8PkAOcXy20w0vlaXaVUearIOBhiXZ5V3ynxwA=="
crossorigin=""></script>
</head>
<body>
<div id="map" style="width: 100%; height: 400px"></div>
<script>
// Creating map options
var mapOptions = {
center: [39.385044, 114.486671],
zoom: 8
}
// Creating a map object
var map = new L.map('map', mapOptions);
// Creating a Layer object
var tiles = L.tileLayer(
'https://api.mapbox.com/styles/v1/{id}/tiles/{z}/{x}/{y}?access_token=pk.eyJ1IjoibWFwYm94IiwiYSI6ImNpejY4NXVycTA2emYycXBndHRqcmZ3N3gifQ.rJcFIG214AriISLbB6B5aw', {
maxZoom: 18,
attribution: 'Map data © <a href="https://www.openstreetmap.org/copyright">OpenStreetMap</a> contributors, ' +
'Imagery <a href="https://www.mapbox.com/">Mapbox</a>',
id: 'mapbox/streets-v11',
tileSize: 512,
zoomOffset: -1
}).addTo(map);
// add a marker
var marker = L.marker([39.52, 114.31]).addTo(map);
// popup
marker.bindPopup('这是1个Marker').openPopup();
// add a circle
var circle = L.circle([40.52, 114.31], {
color: 'green',
fillColor: '#f03',
fillOpacity: 0.5,
radius: 10000
}).addTo(map);
// popup
circle.bindPopup('这是1个Circle');
// add a polygon
var polygon = L.polygon([
[39.8, 116],
[40.1, 116.5],
[39.6, 115],
[39.7, 112.2]
]).addTo(map);
// popup
polygon.bindPopup('这是1个polygon');
// add a popups layers
var popup = L.popup()
.setLatLng([40.5, 115])
.setContent('俺这是1个Popup图层')
// .openOn(map);
.addTo(map);
// Creating latlng object
var latlngs = [
[39.385044, 114.486671],
[39.506174, 115.648015],
[39.000538, 114.804034],
[39.686816, 112.218482]
];
// Creating a poly line
var polyline = L.polyline(latlngs, {
color: 'red'});
// Adding to poly line to map
polyline.addTo(map);
</script>
</body>
</html>
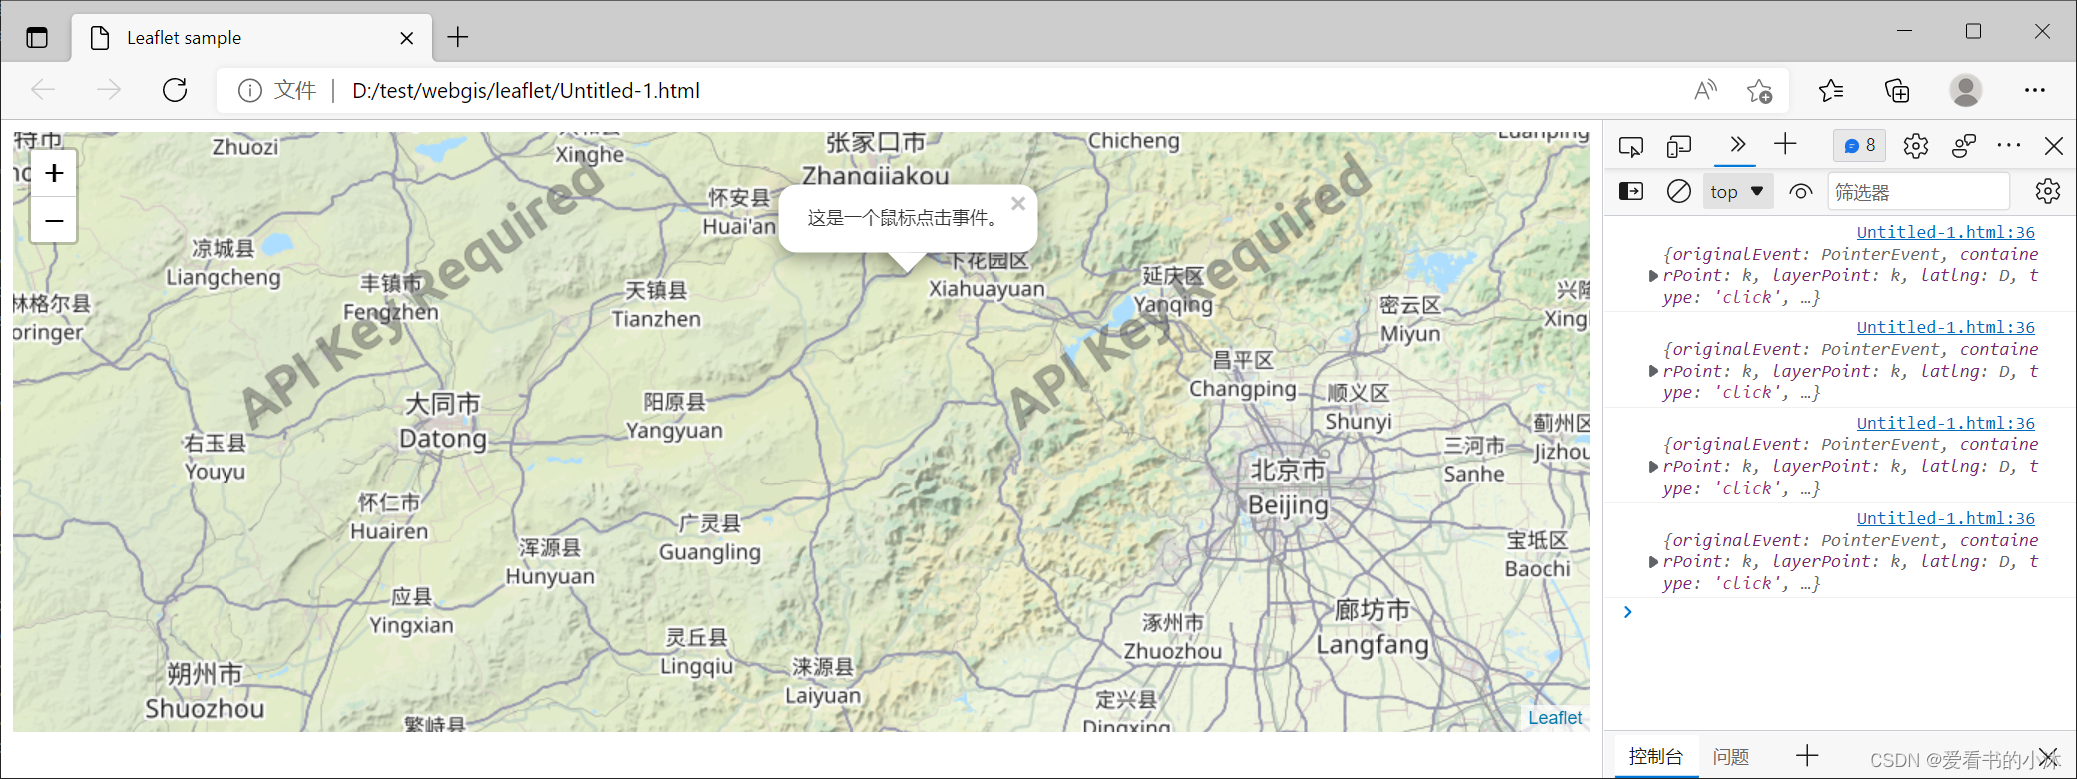
3.3 事件处理( Event Handling)
Leaflet JavaScript程序可以响应用户生成的各种事件。
<!DOCTYPE html>
<html>

<head>
    <title>Leaflet sample</title>
    <link rel="stylesheet" href="https://unpkg.com/[email protected]/dist/leaflet.css"
        integrity="sha512-xodZBNTC5n17Xt2atTPuE1HxjVMSvLVW9ocqUKLsCC5CXdbqCmblAshOMAS6/keqq/sMZMZ19scR4PsZChSR7A=="
        crossorigin="" />
    <script src="https://unpkg.com/[email protected]/dist/leaflet.js"
        integrity="sha512-XQoYMqMTK8LvdxXYG3nZ448hOEQiglfqkJs1NOQV44cWnUrBc8PkAOcXy20w0vlaXaVUearIOBhiXZ5V3ynxwA=="
        crossorigin=""></script>

</head>

<body>
    <div id="map" style="width: 100%; height: 400px"></div>
    <script>
        // Creating map options
        var mapOptions = {

            center: [39.385044, 114.486671],
            zoom: 8
        }
        // Creating a map object
        var map = new L.map('map', mapOptions);

        // Creating a Layer object
        var tiles = L.tileLayer(
            'http://tile.thunderforest.com/cycle/{z}/{x}/{y}.png'
        ).addTo(map)

        map.on("click", function (e) {

            var popup = L.popup()
            .setLatLng([40.5, 115])
            .setContent('这是一个鼠标点击事件。')
            .openOn(map);
            console.log(e);
        })
    </script>
</body>

</html>
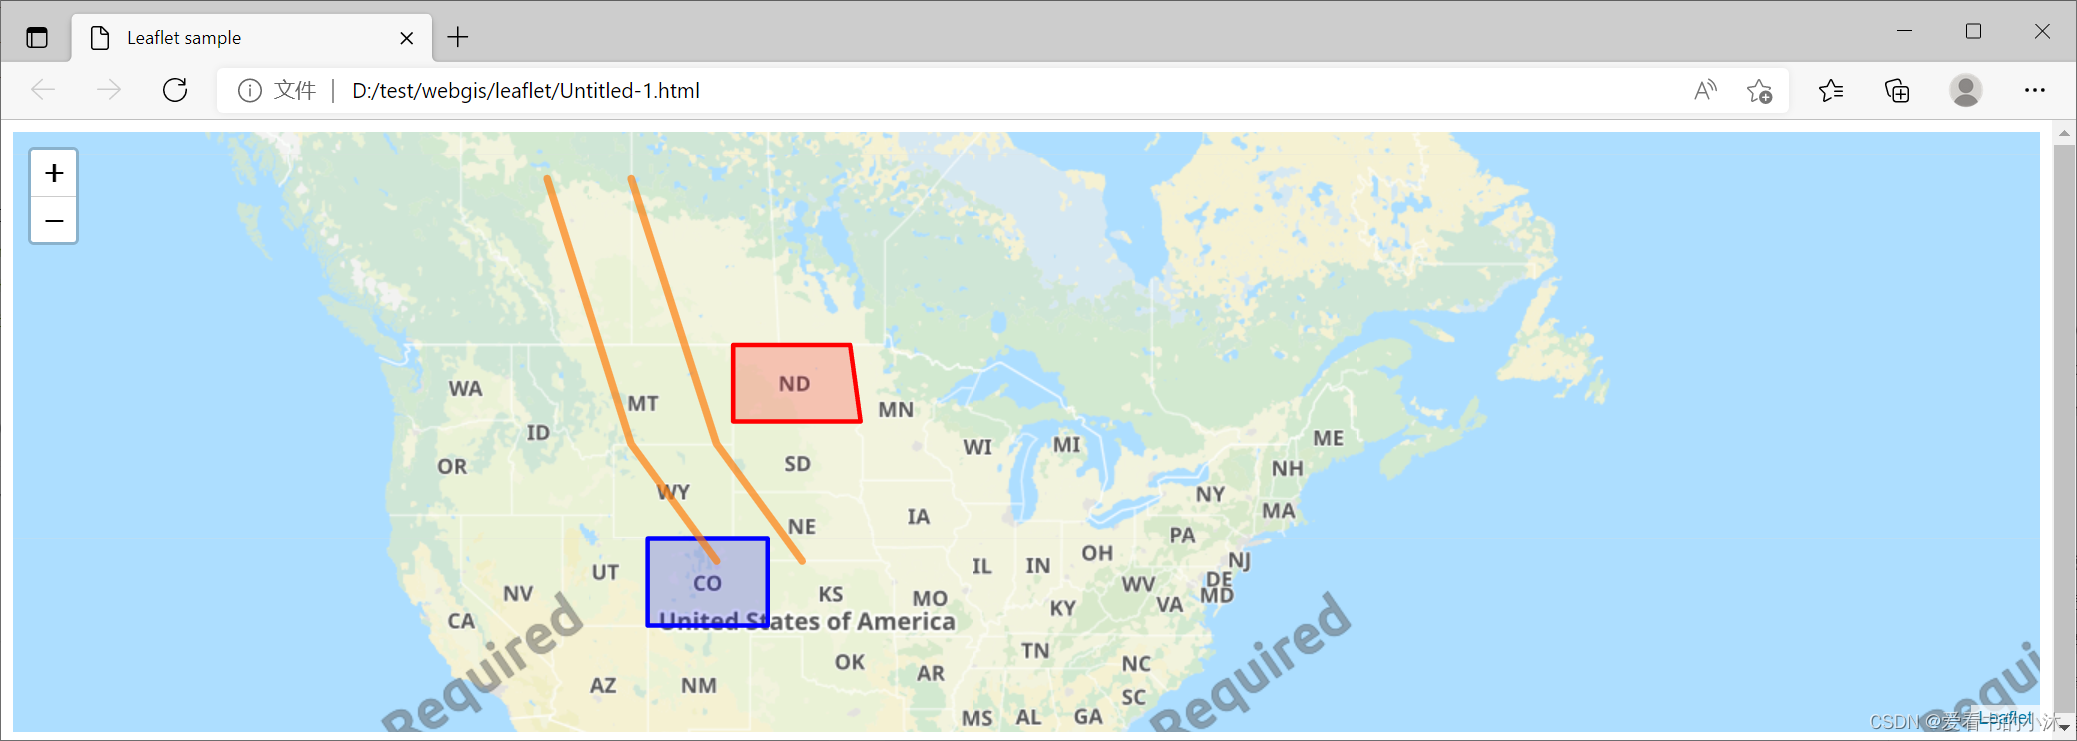
3.4 GeoJSON数据(Using GeoJSON with Leaflet)
<script>
        // Creating map options
        var mapOptions = {

            center: [39.385044, 114.486671],
            zoom: 8
        }
        // Creating a map object
        var map = new L.map('map', mapOptions);

        // Creating a Layer object
        var tiles = L.tileLayer(
            'http://tile.thunderforest.com/cycle/{z}/{x}/{y}.png'
        ).addTo(map)

        map.on("click", function (e) {

            var popup = L.popup()
                .setLatLng([40.5, 115])
                .setContent('这是一个鼠标点击事件。')
                .openOn(map);
            console.log(e);
        })

        var states = [{

            "type": "Feature",
            "properties": {

                "party": "Republican"
            },
            "geometry": {

                "type": "Polygon",
                "coordinates": [
                    [
                        [-104.05, 48.99],
                        [-97.22, 48.98],
                        [-96.58, 45.94],
                        [-104.03, 45.94],
                        [-104.05, 48.99]
                    ]
                ]
            }
        }, {

            "type": "Feature",
            "properties": {

                "party": "Democrat"
            },
            "geometry": {

                "type": "Polygon",
                "coordinates": [
                    [
                        [-109.05, 41.00],
                        [-102.06, 40.99],
                        [-102.03, 36.99],
                        [-109.04, 36.99],
                        [-109.05, 41.00]
                    ]
                ]
            }
        }];

        L.geoJSON(states, {

            style: function (feature) {

                switch (feature.properties.party) {

                    case 'Republican':
                        return {

                            color: "#ff0000"
                        };
                    case 'Democrat':
                        return {

                            color: "#0000ff"
                        };
                }
            }
        }).addTo(map);

        var myLines = [{

            "type": "LineString",
            "coordinates": [
                [-100, 40],
                [-105, 45],
                [-110, 55]
            ]
        }, {

            "type": "LineString",
            "coordinates": [
                [-105, 40],
                [-110, 45],
                [-115, 55]
            ]
        }];

        var myStyle = {

            "color": "#ff7800",
            "weight": 5,
            "opacity": 0.65
        };

        L.geoJSON(myLines, {

            style: myStyle
        }).addTo(map);
    </script>
3.5 缩放层级(Zoom Levels)
- A note about scale
<!DOCTYPE html>
<html>

<head>
    <title>Leaflet sample</title>

    <link rel="stylesheet" href="https://unpkg.com/[email protected]/dist/leaflet.css" />
    <script src="https://unpkg.com/[email protected]/dist/leaflet.js"></script>

    <style>
        body {

            padding: 0;
            margin: 0;
        }

        html,
        body,
        #map {

            height: 100%;
            font: 10pt "Helvetica Neue", Arial, Helvetica, sans-serif;
        }
    </style>
</head>

<body>
    <div id="map"></div>
    <script>
        var mapOptions = {

            center: [39.385044, 114.486671],
            zoom: 8
        }

        // Creating a map object
        var map = new L.map('map', mapOptions);

        L.tileLayer('http://tile.thunderforest.com/cycle/{z}/{x}/{y}.png')
            .addTo(map);

        L.control.scale().addTo(map);

        setInterval(function () {

            map.setView([39.385044, 114.486671]);
            setTimeout(function () {

                map.setView([40.385044, 115.486671]);
            }, 2000);
        }, 4000);
    </script>
</body>

</html>
- Controlling the zoom
<!DOCTYPE html>
<html>

<head>
    <title>Leaflet sample</title>

    <link rel="stylesheet" href="https://unpkg.com/[email protected]/dist/leaflet.css" />
    <script src="https://unpkg.com/[email protected]/dist/leaflet.js"></script>

    <style>
        body {

            padding: 0;
            margin: 0;
        }

        html,
        body,
        #map {

            height: 100%;
            font: 10pt "Helvetica Neue", Arial, Helvetica, sans-serif;
        }
    </style>
</head>

<body>
    <div id="map"></div>
    <script>
        var mapOptions = {

            center: [39.385044, 114.486671],
            zoom: 8
        }

        // Creating a map object
        var map = new L.map('map', mapOptions);

        L.tileLayer('http://tile.thunderforest.com/cycle/{z}/{x}/{y}.png')
            .addTo(map);

        L.control.scale().addTo(map);

        setInterval(function () {

            map.setZoom(8);
            console.log("zoom: " + map.getZoom());

            setTimeout(function () {

                map.setZoom(9);
                console.log("zoom: " + map.getZoom());
            }, 2000);
        }, 4000);
    </script>
</body>

</html>

3.6 WMS and TMS
<!DOCTYPE html>
<html>

<head>
    <title>Leaflet sample</title>

    <link rel="stylesheet" href="https://unpkg.com/[email protected]/dist/leaflet.css" />
    <script src="https://unpkg.com/[email protected]/dist/leaflet.js"></script>

    <style>
        body {

            padding: 0;
            margin: 0;
        }

        html,
        body,
        #map {

            height: 100%;
            font: 10pt "Helvetica Neue", Arial, Helvetica, sans-serif;
        }
    </style>
</head>

<body>
    <div id="map"></div>
    <script>
        var mapOptions = {

            center: [39.385044, 114.486671],
            zoom: 8
        }

        // Creating a map object
        var map = new L.map('map', mapOptions);
        L.control.scale().addTo(map);

        L.tileLayer('http://tile.thunderforest.com/cycle/{z}/{x}/{y}.png')
            .addTo(map);

        var basemaps = {

            Topography: L.tileLayer.wms('http://ows.mundialis.de/services/service?', {

                layers: 'TOPO-WMS'
            }),

            Places: L.tileLayer.wms('http://ows.mundialis.de/services/service?', {

                layers: 'OSM-Overlay-WMS'
            }),

            'Topography, then places': L.tileLayer.wms('http://ows.mundialis.de/services/service?', {

                layers: 'TOPO-WMS,OSM-Overlay-WMS'
            }),

            'Places, then topography': L.tileLayer.wms('http://ows.mundialis.de/services/service?', {

                layers: 'OSM-Overlay-WMS,TOPO-WMS'
            }),
            'TOPO-OSM-WMS': L.tileLayer.wms('http://ows.mundialis.de/services/service?', {

                layers: 'TOPO-OSM-WMS'
            }),
            'SRTM30-Colored-Hillshade': L.tileLayer.wms('http://ows.mundialis.de/services/service?', {

                layers: 'SRTM30-Colored-Hillshade'
            })
        };

        L.control.layers(basemaps).addTo(map);

        basemaps.Topography.addTo(map);
    </script>
</body>

</html>

4、扩展功能
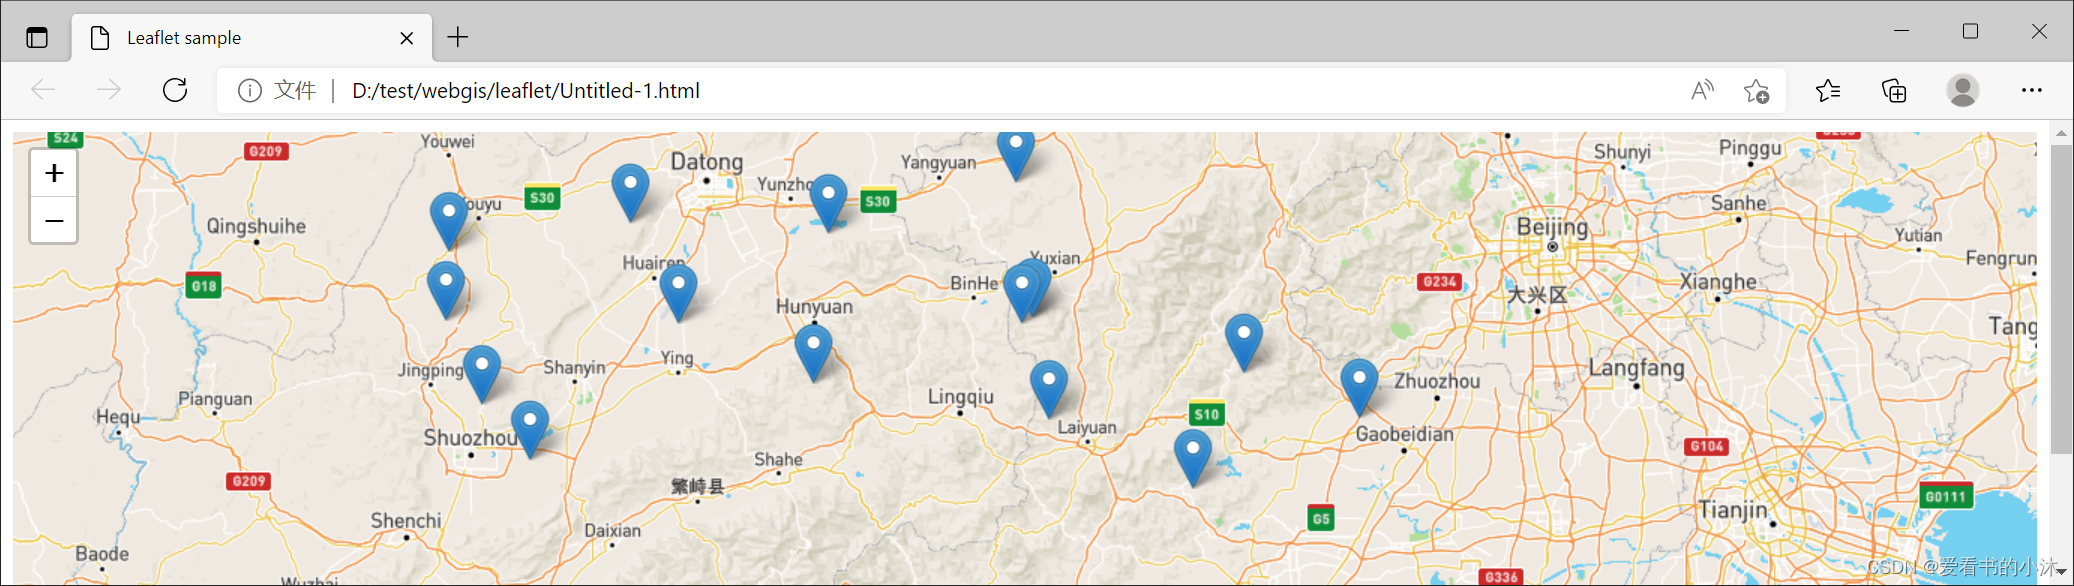
4.1 实现鼠标点击创建marker
<script>
// Creating map options
var mapOptions = {
center: [39.385044, 114.486671],
zoom: 8
}
// Creating a map object
var map = new L.map('map', mapOptions);
// Creating a Layer object
var tiles = L.tileLayer(
'https://api.mapbox.com/styles/v1/{id}/tiles/{z}/{x}/{y}?access_token=pk.eyJ1IjoibWFwYm94IiwiYSI6ImNpejY4NXVycTA2emYycXBndHRqcmZ3N3gifQ.rJcFIG214AriISLbB6B5aw', {
maxZoom: 18,
attribution: 'Map data © <a href="https://www.openstreetmap.org/copyright">OpenStreetMap</a> contributors, ' +
'Imagery <a href="https://www.mapbox.com/">Mapbox</a>',
id: 'mapbox/streets-v11',
tileSize: 512,
zoomOffset: -1
}).addTo(map);
map.on("click", function (e) {
new L.Marker([e.latlng.lat, e.latlng.lng]).addTo(map);
console.log(e);
})
</script>
4.2 实现鼠标点击显示当前经纬度
<script>
// Creating map options
var mapOptions = {
center: [39.385044, 114.486671],
zoom: 8
}
// Creating a map object
var map = new L.map('map', mapOptions);
// Creating a Layer object
var tiles = L.tileLayer(
'https://api.mapbox.com/styles/v1/{id}/tiles/{z}/{x}/{y}?access_token=pk.eyJ1IjoibWFwYm94IiwiYSI6ImNpejY4NXVycTA2emYycXBndHRqcmZ3N3gifQ.rJcFIG214AriISLbB6B5aw', {
maxZoom: 18,
attribution: 'Map data © <a href="https://www.openstreetmap.org/copyright">OpenStreetMap</a> contributors, ' +
'Imagery <a href="https://www.mapbox.com/">Mapbox</a>',
id: 'mapbox/streets-v11',
tileSize: 512,
zoomOffset: -1
}).addTo(map);
// use event
var mypop = L.popup();
map.on('click', function (e) {
console.log(e);
//alert('纬度:' + e.latlng.lat + '\n经度:' + e.latlng.lng);
var content = '这个点的经纬度:<br>';
content += e.latlng.toString();
mypop.setLatLng(e.latlng)
.setContent(content)
.openOn(map);
});
</script>

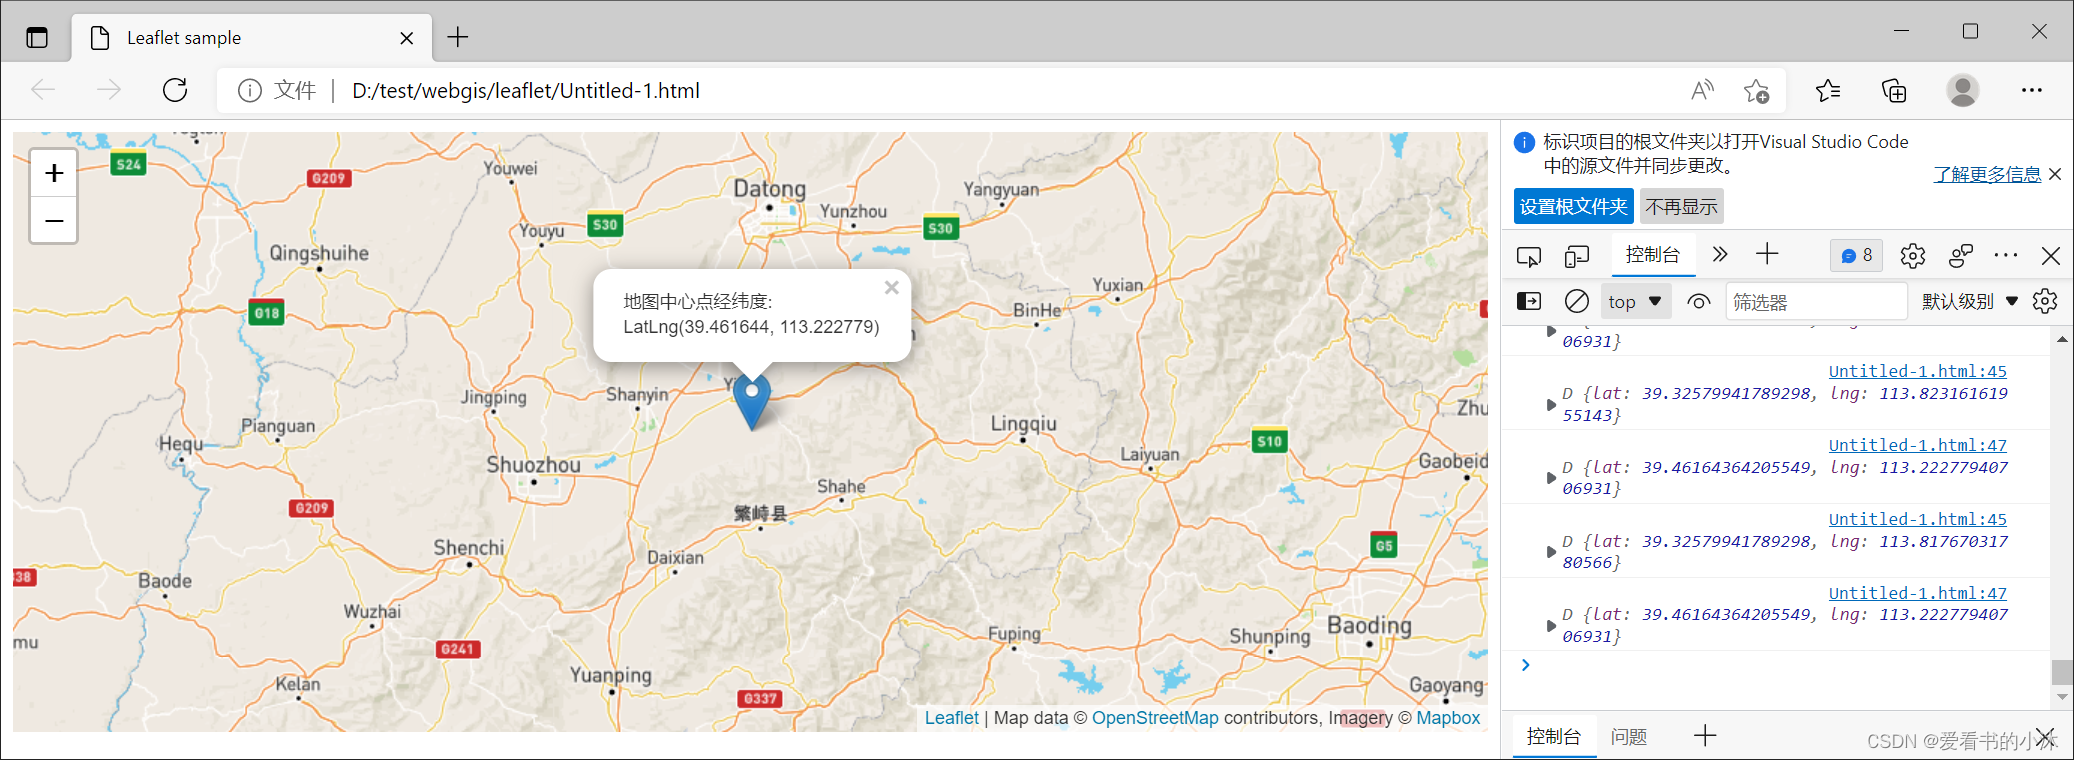
4.3 实现地图中心点显示经纬度
// add a marker
var marker = L.marker([39.52, 114.31]).addTo(map);

// 监听 mousemove 事件
map.on('mousemove', (e) => {

    let latlng = e.latlng;
    console.log(latlng );

    console.log(map.getCenter())
    marker.bindPopup('地图中心点经纬度:<br>' + map.getCenter()).openPopup();
    marker.setLatLng(map.getCenter());
});

// 取消 mousemove 事件
//map.off('mousemove');
4.4 实现经纬度跳转
// 中心点
let center = L.latLng(39, 114);

// 平移
this.map.panTo(center);

// 平移,与上面的 panTo 功能一样
this.map.flyTo(center);

// 平移,且缩放到指定级数
this.map.flyTo(center, 5);
<!DOCTYPE html>
<html>

<head>
    <title>Leaflet sample</title>
    <link rel="stylesheet" href="https://unpkg.com/[email protected]/dist/leaflet.css"
        integrity="sha512-xodZBNTC5n17Xt2atTPuE1HxjVMSvLVW9ocqUKLsCC5CXdbqCmblAshOMAS6/keqq/sMZMZ19scR4PsZChSR7A=="
        crossorigin="" />
    <script src="https://unpkg.com/[email protected]/dist/leaflet.js"
        integrity="sha512-XQoYMqMTK8LvdxXYG3nZ448hOEQiglfqkJs1NOQV44cWnUrBc8PkAOcXy20w0vlaXaVUearIOBhiXZ5V3ynxwA=="
        crossorigin=""></script>
    <script src="https://cdn.bootcss.com/jquery/2.2.4/jquery.min.js"></script>
</head>

<body>
    <div id="map" style="width: 100%; height: 400px"></div>
    <div class="panel panel-default" style="margin-top: 20px">

        <div class="panel-body">
            <div class="container">
                <div class="form-group">
                    <div class="col-sm-11">
                        <label class="col-sm-1 control-label">经度</label>
                        <input type="text" class="form-control" id="lon">
                        <label class="col-sm-1 control-label">纬度</label>
                        <input type="text" class="form-control" id="lat">
                        <button id="search" class="btn btn-success">查询</button>
                    </div>
                </div>

            </div>
        </div>
    </div>
    <script>
        //Creating map options
        var mapOptions = {

            center: [39.385044, 114.486671],
            zoom: 5
        }
        // Creating a map object
        var map = new L.map('map', mapOptions);

        // var latlng = L.latLng(39.385044, 114.486671);
        // var map = L.map('map', { center: latlng, zoom: 8 });

        // Creating Layer objects
        var baseLayers = {

            "高德卫星图": L.tileLayer(
                'https://webst0{s}.is.autonavi.com/appmaptile?style=6&x={x}&y={y}&z={z}', {

                    subdomains: "1234"
                }),
            "高德路网图": L.tileLayer(
                'https://webrd0{s}.is.autonavi.com/appmaptile?lang=zh_cn&size=1&scale=1&style=8&x={x}&y={y}&z={z}', {

                    subdomains: "1234"
                }),
            "高德矢量图": L.tileLayer(
                'https://webrd0{s}.is.autonavi.com/appmaptile?lang=zh_cn&size=1&scale=1&style=7&x={x}&y={y}&z={z}', {

                    subdomains: "1234"
                }),
            'GeoQ深蓝图': L.tileLayer(
                'http://map.geoq.cn/ArcGIS/rest/services/ChinaOnlineStreetPurplishBlue/MapServer/tile/{z}/{y}/{x}'
            ).addTo(map),

        };

        var layercontrol = L.control.layers(baseLayers, {
    }, {

            position: "topleft"
        }).addTo(map);

        function onMapClick(e) {

            var popup = L.popup();
            popup.setLatLng(e.latlng)
                .setContent("你点击的位置在 " + e.latlng.toString())
                .openOn(map);
        }
        map.on('click', onMapClick);

        var marker = L.marker([0, 0]).addTo(map);

        $('#search').click(function () {

            var name = $('#lat').val();
            var address = $('#lon').val();
            if (name == '' || address == '') {

                alert('查询条件为空!');
            } else {

                var lat = $('#lat').val();
                var lon = $('#lon').val();

                let center = L.latLng(lat, lon);
                map.flyTo(center, 6);

                marker.setLatLng(center);
                marker.bindPopup('地图中心点经纬度:<br>' + center).openPopup();
            }

        });
    </script>
</body>

</html>
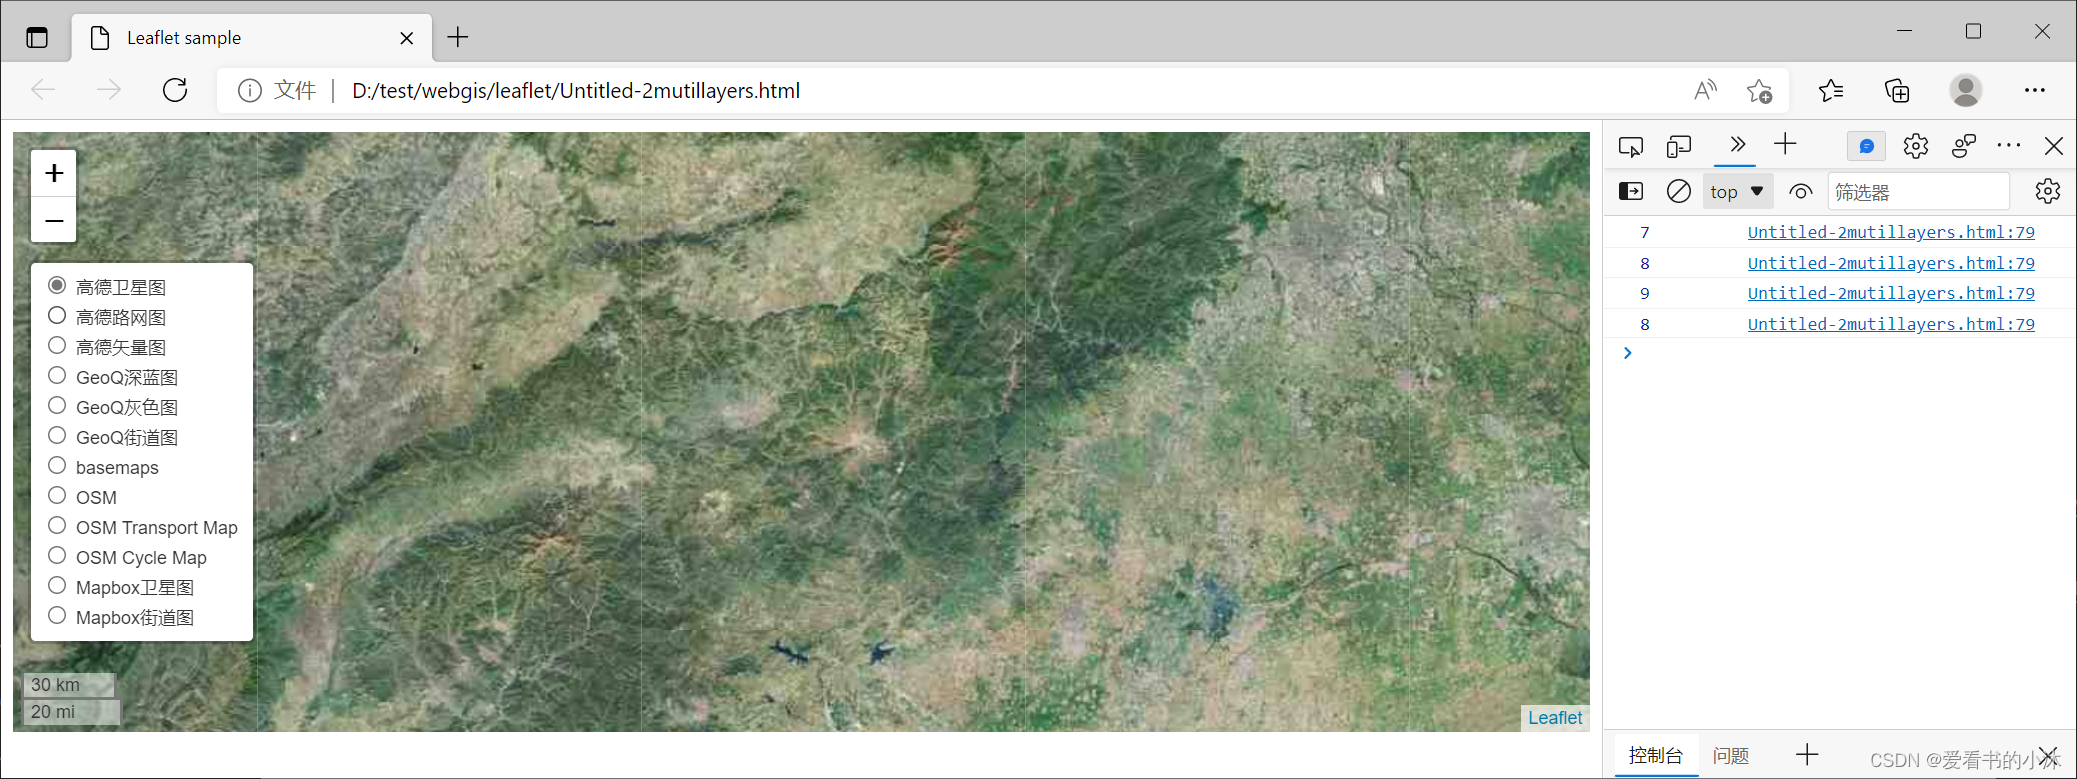
4.5 实现多个地图层切换
<script>
// Creating map options
var mapOptions = {

    center: [39.385044, 114.486671],
    zoom: 8
}
// Creating a map object
var map = new L.map('map', mapOptions);

// var latlng = L.latLng(39.385044, 114.486671);
// var map = L.map('map', { center: latlng, zoom: 8 });

// Creating Layer objects
var baseLayers = {

    "高德卫星图": L.tileLayer(
        'https://webst0{s}.is.autonavi.com/appmaptile?style=6&x={x}&y={y}&z={z}', {

            subdomains: "1234"
        }),
    "高德路网图": L.tileLayer(
        'https://webrd0{s}.is.autonavi.com/appmaptile?lang=zh_cn&size=1&scale=1&style=8&x={x}&y={y}&z={z}', {

            subdomains: "1234"
        }),
    "高德矢量图": L.tileLayer(
        'https://webrd0{s}.is.autonavi.com/appmaptile?lang=zh_cn&size=1&scale=1&style=7&x={x}&y={y}&z={z}', {

            subdomains: "1234"
        }),
    'GeoQ深蓝图': L.tileLayer(
        'http://map.geoq.cn/ArcGIS/rest/services/ChinaOnlineStreetPurplishBlue/MapServer/tile/{z}/{y}/{x}'
    ),
    'GeoQ灰色图': L.tileLayer(
        'http://map.geoq.cn/ArcGIS/rest/services/ChinaOnlineStreetGray/MapServer/tile/{z}/{y}/{x}'
    ),
    'GeoQ街道图': L.tileLayer(
        'http://map.geoq.cn/ArcGIS/rest/services/ChinaOnlineCommunity/MapServer/tile/{z}/{y}/{x}'
    ),
    'basemaps': L.tileLayer(
        'http://{s}.basemaps.cartocdn.com/light_all/{z}/{x}/{y}.png', {

            attribution: "cartodbAttribution"
        }),
    'Mapbox卫星图': L.tileLayer(
        'https://api.mapbox.com/styles/v1/mapbox/satellite-v9/tiles/512/{z}/{x}/{y}@2x?access_token=our key'
    ),
    'Mapbox街道图': L.tileLayer(
        'https://api.mapbox.com/styles/v1/mapbox/streets-v11/tiles/512/{z}/{x}/{y}@2x?access_token=your key'
    ),
    'OSM': L.tileLayer(
        'https://c.tile.openstreetmap.org/{z}/{x}/{y}.png'
    ),
    'OSM Transport Map': L.tileLayer(
        'http://tile.thunderforest.com/transport/{z}/{x}/{y}.png'
    ),
    'OSM Cycle Map': L.tileLayer(
        'http://tile.thunderforest.com/cycle/{z}/{x}/{y}.png'
    ).addTo(map),
};

var layercontrol = L.control.layers(baseLayers, {
    }, {

    position: "topleft"
}).addTo(map);

L.control.scale().addTo(map);
map.on('zoomend', showZoomLevel);
function showZoomLevel() {

    console.log(map.getZoom());
}
</script>
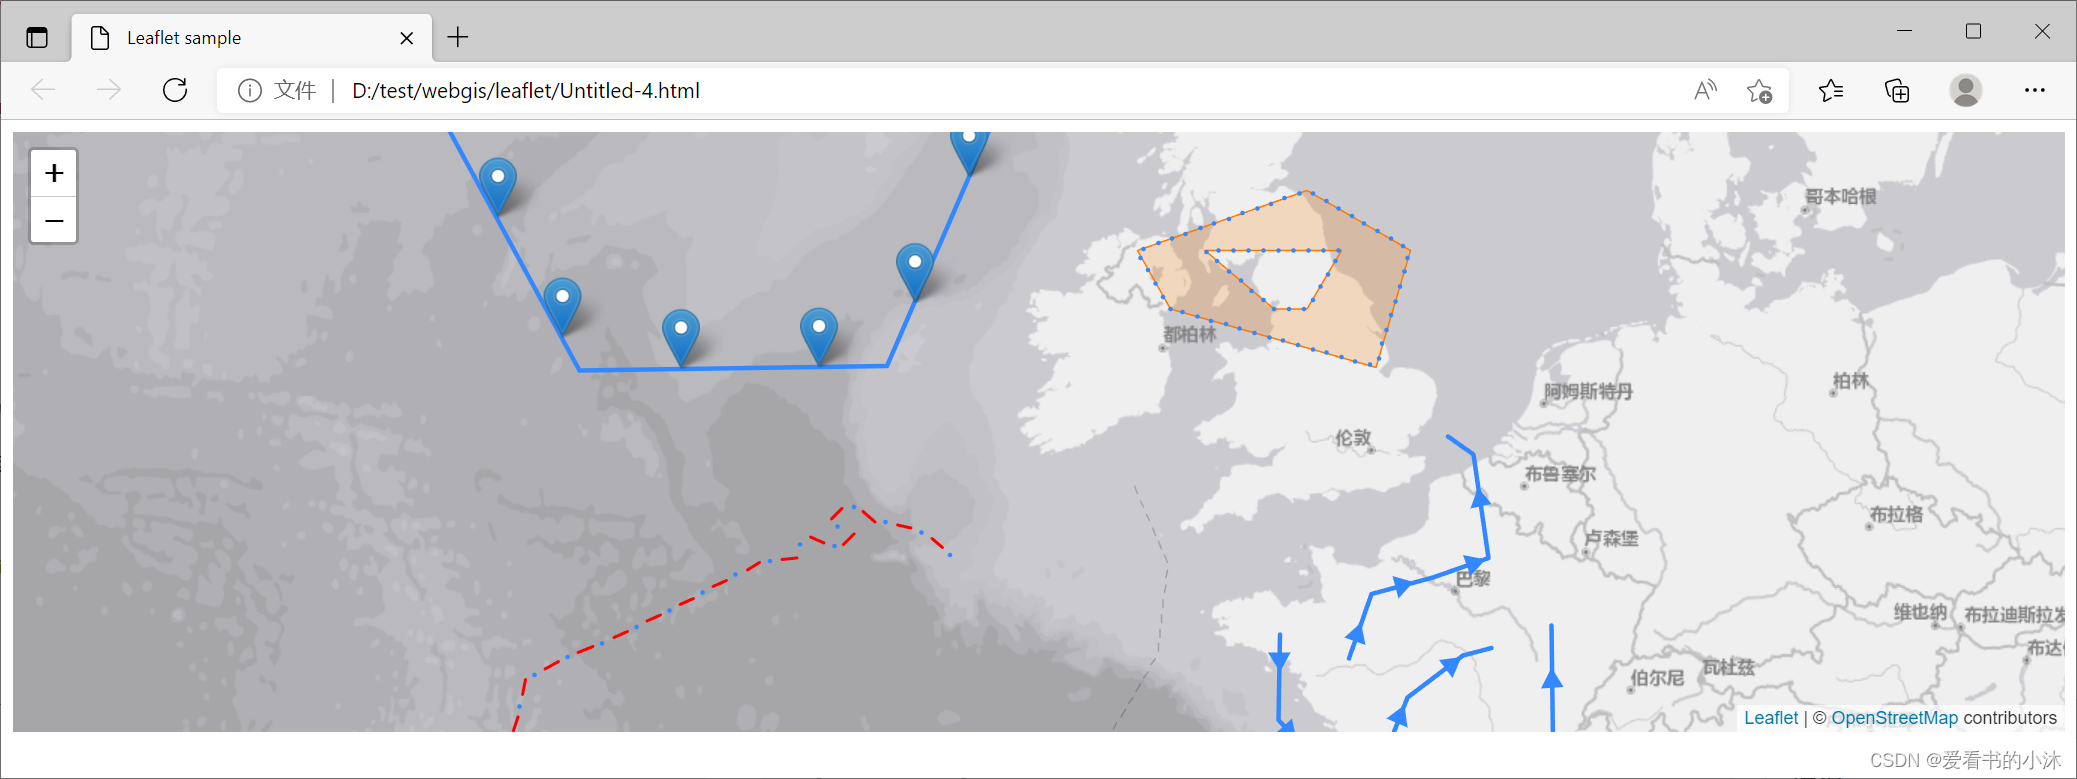
4.6 实现绘制静止轨迹线
<script src="dist/leaflet.polylineDecorator.js"></script>
var map = L.map('map', {
center: [52.0, -11.0],
zoom: 5,
layers: [
L.tileLayer('http://map.geoq.cn/ArcGIS/rest/services/ChinaOnlineStreetGray/MapServer/tile/{z}/{y}/{x}', {
attribution: '© <a href="http://osm.org/copyright">OpenStreetMap</a> contributors'
})
]
});
// --- Simple arrow ---
var arrow = L.polyline([
[57, -19],
[60, -12]
], {
}).addTo(map);
var arrowHead = L.polylineDecorator(arrow, {
patterns: [{
offset: '100%',
repeat: 0,
symbol: L.Symbol.arrowHead({
pixelSize: 15,
polygon: false,
pathOptions: {
stroke: true
}
})
}]
}).addTo(map);
// --- Polygon, with an inner ring ---
var polygon = L.polygon([
[
[54, -6],
[55, -7],
[56, -2],
[55, 1],
[53, 0]
],
[
[54, -3],
[54, -2],
[55, -1],
[55, -5]
]
], {
color: "#ff7800",
weight: 1
}).addTo(map);
var pd = L.polylineDecorator(polygon, {
patterns: [{
offset: 0,
repeat: 10,
symbol: L.Symbol.dash({
pixelSize: 0
})
}]
}).addTo(map);
// --- Multi-pattern without Polyline ---
var pathPattern = L.polylineDecorator(
[
[49.543519, -12.469833],
[49.808981, -12.895285],
[50.056511, -13.555761],
[50.217431, -14.758789],
[50.476537, -15.226512],
[50.377111, -15.706069],
[50.200275, -16.000263],
[49.860606, -15.414253],
[49.672607, -15.710152],
[49.863344, -16.451037],
[49.774564, -16.875042],
[49.498612, -17.106036],
[49.435619, -17.953064],
[49.041792, -19.118781],
[48.548541, -20.496888],
[47.930749, -22.391501],
[47.547723, -23.781959],
[47.095761, -24.941630],
[46.282478, -25.178463],
[45.409508, -25.601434],
[44.833574, -25.346101],
[44.039720, -24.988345]
], {
patterns: [{
offset: 12,
repeat: 25,
symbol: L.Symbol.dash({
pixelSize: 10,
pathOptions: {
color: '#f00',
weight: 2
}
})
},
{
offset: 0,
repeat: 25,
symbol: L.Symbol.dash({
pixelSize: 0
})
}
]
}
).addTo(map);
// --- Markers proportionnaly located ---
var markerLine = L.polyline([
[58.44773, -28.65234],
[52.9354, -23.33496],
[53.01478, -14.32617],
[58.1707, -10.37109],
[59.68993, -0.65918]
], {
}).addTo(map);
var markerPatterns = L.polylineDecorator(markerLine, {
patterns: [{
offset: '5%',
repeat: '10%',
symbol: L.Symbol.marker()
}]
}).addTo(map);
// --- Example with a rotated marker ---
var pathPattern = L.polylineDecorator(
[
[42.9, -15],
[44.18, -11.4],
[45.77, -8.0],
[47.61, -6.4],
[49.41, -6.1],
[51.01, -7.2]
], {
patterns: [{
offset: 0,
repeat: 10,
symbol: L.Symbol.dash({
pixelSize: 5,
pathOptions: {
color: '#000',
weight: 1,
opacity: 0.2
}
})
},
{
offset: '16%',
repeat: '33%',
symbol: L.Symbol.marker({
rotate: true,
markerOptions: {
icon: L.icon({
iconUrl: 'icon_plane.png',
iconAnchor: [16, 16]
})
}
})
}
]
}
).addTo(map);
// --- Example with an array of Polylines ---
var multiCoords1 = [
[
[47.5468, -0.7910],
[48.8068, -0.1318],
[49.1242, 1.6699],
[49.4966, 3.2958],
[51.4266, 2.8564],
[51.7542, 2.1093]
],
[
[48.0193, -2.8125],
[46.3165, -2.8564],
[44.9336, -1.0107],
[44.5278, 1.5820],
[44.8714, 3.7353],
[45.8287, 5.1855],
[48.1953, 5.1416]
],
[
[45.9205, 0.4394],
[46.7699, 0.9228],
[47.6061, 2.5488],
[47.7540, 3.3837]
]
];
var plArray = [];
for (var i = 0; i < multiCoords1.length; i++) {
plArray.push(L.polyline(multiCoords1[i]).addTo(map));
}
L.polylineDecorator(multiCoords1, {
patterns: [{
offset: 25,
repeat: 50,
symbol: L.Symbol.arrowHead({
pixelSize: 15,
pathOptions: {
fillOpacity: 1,
weight: 0
}
})
}]
}).addTo(map);
4.7 实现绘制动画轨迹线
https://github.com/Igor-Vladyka/leaflet.motion
需要额外引用另一个库,如下:
<script src="dist/leaflet.motion.min.js"></script>
//http://{s}.basemaps.cartocdn.com/light_all/{z}/{x}/{y}.png

var planeIcon = L.icon({

    iconUrl: 'img/plane.png',
    iconSize: [25.1, 25],
});
L.motion.polyline([
    [39.65, 114.05],
    [39.55, 114.10],
    [39.75, 114.15],
    [39.40, 114.15],
    [39.15, 114.3],
    [39.85, 115.3],
], {

    color: 'red'
}, {

    auto: true,
    duration: 5000,
    easing: L.Motion.Ease.easeInOutQuart
}, {

    removeOnEnd: false,
    icon: planeIcon
}).addTo(map);
//http://map.geoq.cn/ArcGIS/rest/services/ChinaOnlineStreetPurplishBlue/MapServer/tile/{z}/{y}/{x}

L.motion.polyline([
    [39, 114],
    [32, 112],
    [40, 110],
    [35, 108],
    [41, 105]
], {

    color: "transparent"
}, {

    auto: true,
    duration: 5000,
    easing: L.Motion.Ease.easeInOutQuart
}, {

    removeOnEnd: true,
    showMarker: true,
    icon: L.divIcon({

        html: "<i class='fa fa-car fa-2x' aria-hidden='true'></i>",
        iconSize: L.point(27.5, 24)
    })
}).addTo(map);
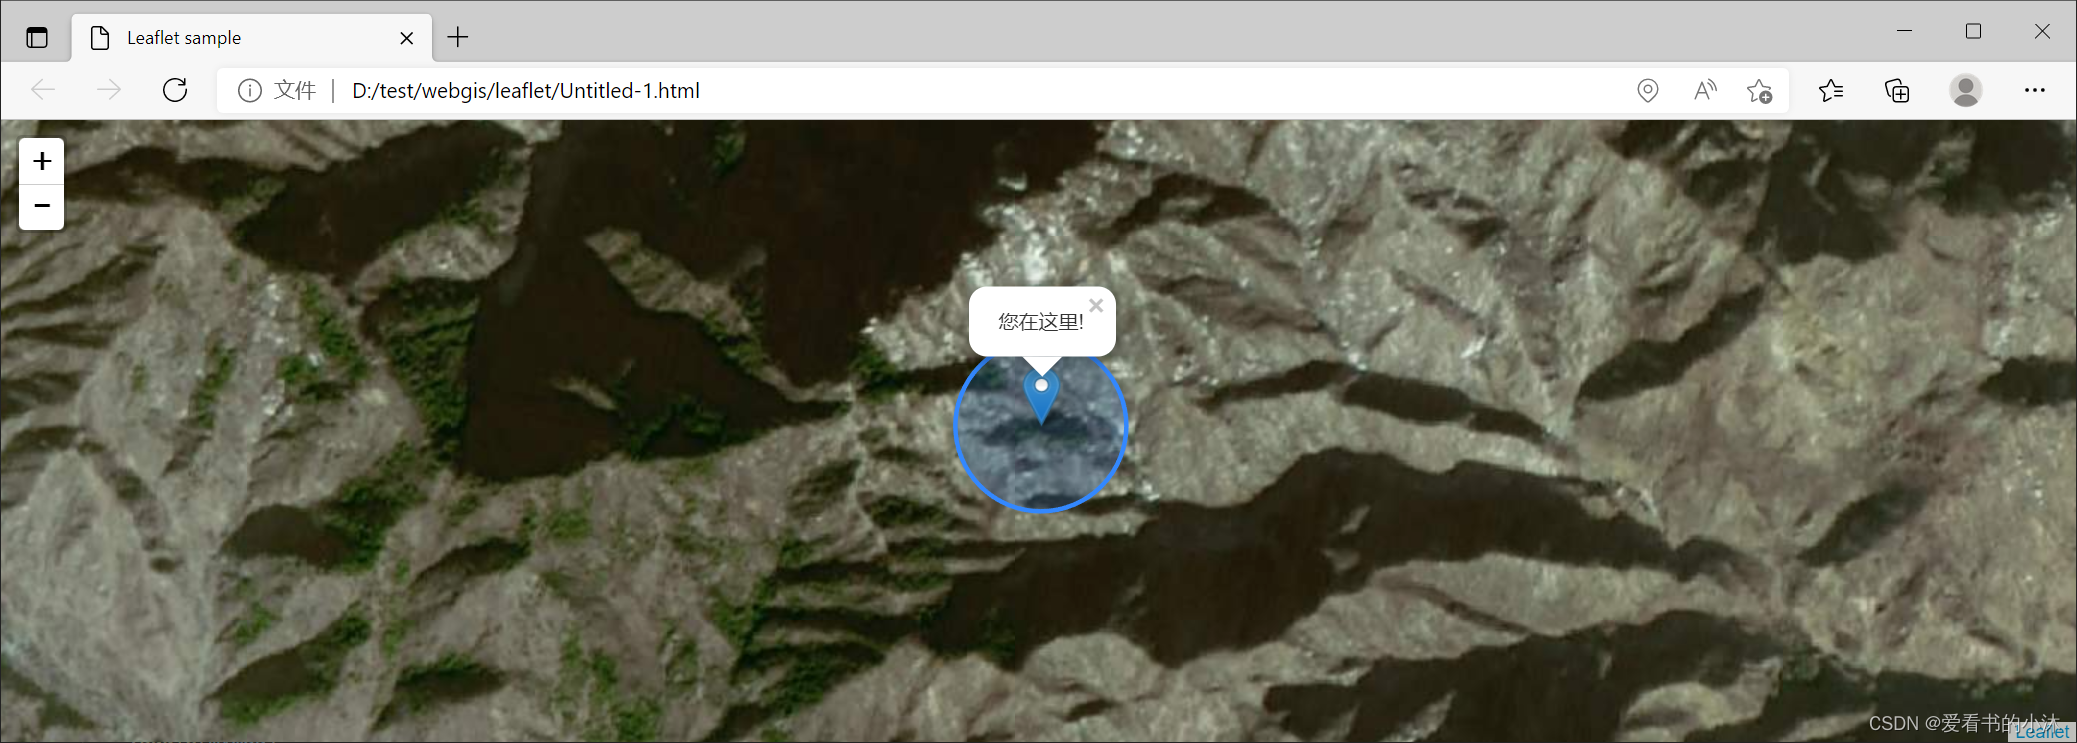
4.8 实现获取自己的当前定位信息
- 定位1:使用自带功能
<script>
var mymap = L.map('map');
 mymap.locate({

     setView: true,
     maxZoom: 16
 });

 var position = [];
 L.tileLayer(
     'http://tile.thunderforest.com/cycle/{z}/{x}/{y}.png', {

         maxZoom: 18,
         id: 'mapbox.streets'
     }).addTo(mymap);

 function onLocationFound(e) {

     L.marker(e.latlng, {

             draggable: true
         })
         .addTo(mymap)
         .bindPopup("您在这里!").openPopup()
         .on('dragend', function (event) {

             var marker = event.target;
             var latlng = marker.getLatLng();
             position.push(latlng);
         });

     var radius = e.accuracy / 2;
     //L.marker(e.latlng).addTo(mymap).bindPopup("你就在这个圈内");
     L.circle(e.latlng, radius).addTo(mymap);
 }

 function onLocationError() {

     L.marker(mymap.getCenter(), {

             draggable: true
         })
         .addTo(mymap)
         .bindPopup("<b>请在地图上手动选择您的位置!</b>").openPopup()
         .on('dragend', function (event) {

             var marker = event.target;
             var latlng = marker.getLatLng();
             position.push(latlng);
         });
 }

 mymap.on('locationerror', onLocationError);
 mymap.on('locationfound', onLocationFound);

</script>
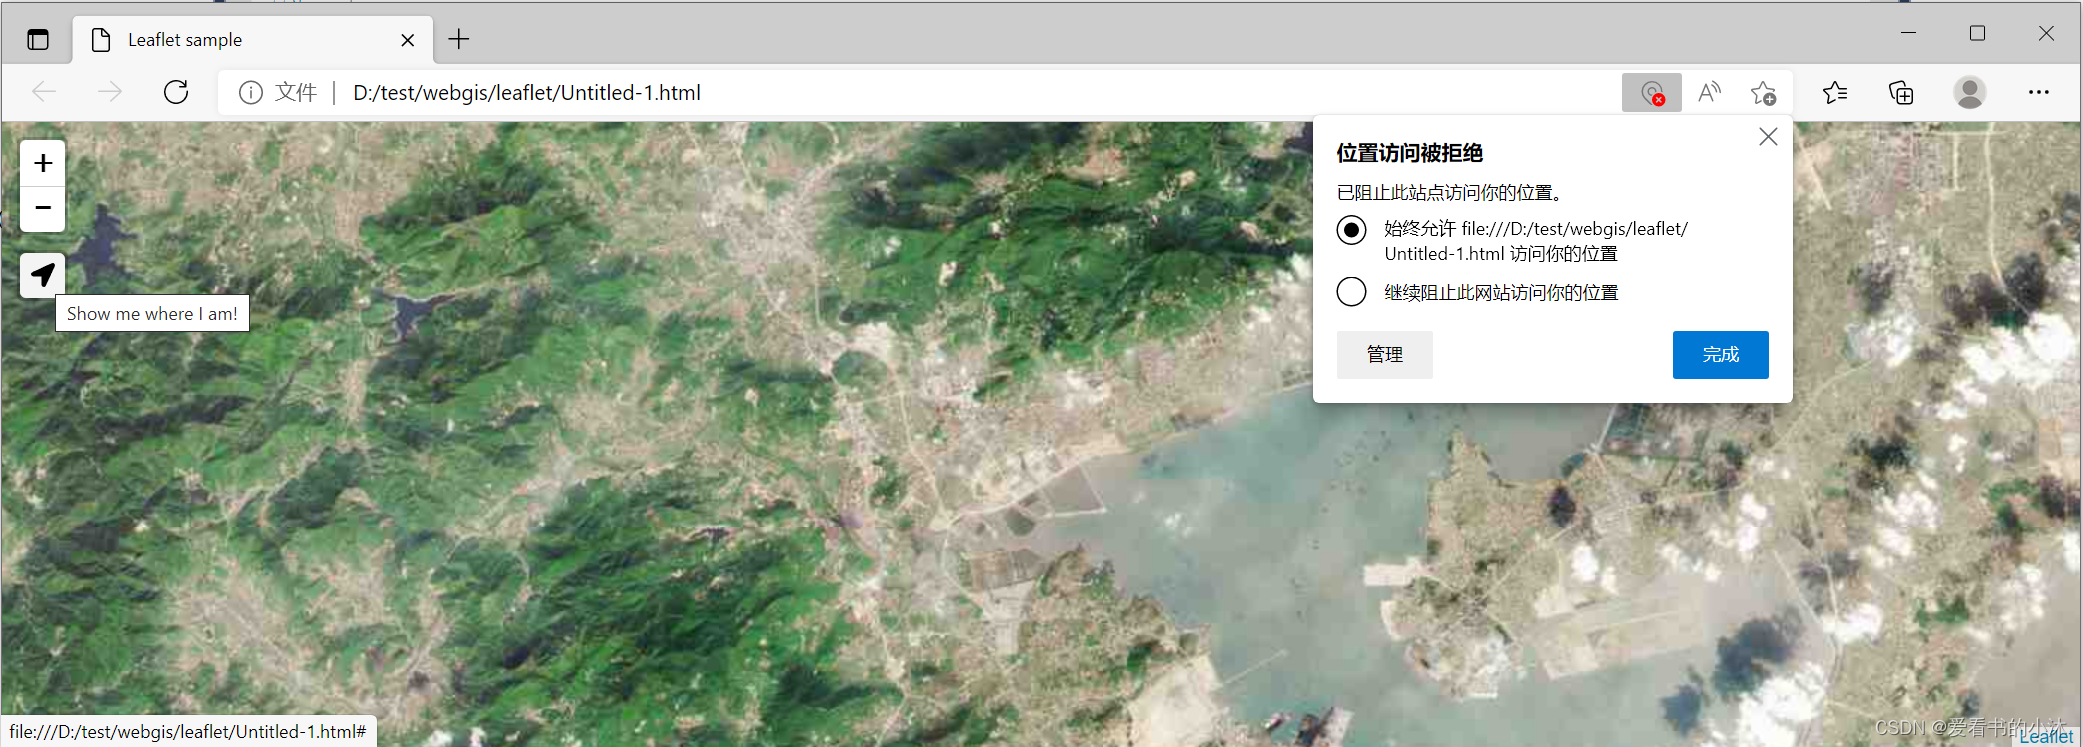
- 定位2:使用第三方库的功能
<link rel="stylesheet" href="https://maxcdn.bootstrapcdn.com/font-awesome/4.7.0/css/font-awesome.min.css">
<link rel="stylesheet" href="https://cdn.jsdelivr.net/npm/leaflet.locatecontrol@latest/dist/L.Control.Locate.min.css" />
<script src="https://cdn.jsdelivr.net/npm/leaflet.locatecontrol@latest/dist/L.Control.Locate.min.js" charset="utf-8"></script>
<!DOCTYPE html>
<html>

<head>
    <title>Leaflet sample</title>

    <link rel="stylesheet" href="https://unpkg.com/[email protected]/dist/leaflet.css" />
    <!--[if lte IE 8]><link rel="stylesheet" href="https://cdn.leafletjs.com/leaflet-0.7.2/leaflet.ie.css" /><![endif]-->
    <script src="https://unpkg.com/[email protected]/dist/leaflet.js"></script>

    <link rel="stylesheet"
        href="https://cdn.jsdelivr.net/npm/leaflet.locatecontrol@latest/dist/L.Control.Locate.min.css" />
    <script src="https://cdn.jsdelivr.net/npm/leaflet.locatecontrol@latest/dist/L.Control.Locate.min.js"
        charset="utf-8"></script>
    <style>
        body {

            padding: 0;
            margin: 0;
        }

        html,
        body,
        #map {

            height: 100%;
            font: 10pt "Helvetica Neue", Arial, Helvetica, sans-serif;
        }
    </style>
</head>

<body>
    <div id="map" ></div>
    <script>
        var mymap = L.map('map');

        L.tileLayer(
            'https://webst0{s}.is.autonavi.com/appmaptile?style=6&x={x}&y={y}&z={z}', {

                subdomains: "1234"
            }).addTo(mymap);

        //添加定位的control
        mymap.addControl(L.control.locate({

            locateOptions: {

                enableHighAccuracy: true
            },
            strings: {

                title: "Show me where I am!"
            }
        }));
    </script>
</body>
</html>
4.9 实现画图工具栏功能
<!DOCTYPE html>
<html>

<head>
    <title>Leaflet sample</title>

    <link rel="stylesheet" href="https://unpkg.com/[email protected]/dist/leaflet.css" />
    <script src="https://unpkg.com/[email protected]/dist/leaflet.js"></script>

    <link rel="stylesheet" href="https://cdnjs.cloudflare.com/ajax/libs/leaflet.draw/0.4.2/leaflet.draw.css" />
    <script src="https://cdnjs.cloudflare.com/ajax/libs/leaflet.draw/0.4.2/leaflet.draw.js"></script>

    <style>
        body {

            padding: 0;
            margin: 0;
        }

        html,
        body,
        #map {

            height: 100%;
            font: 10pt "Helvetica Neue", Arial, Helvetica, sans-serif;
        }
    </style>
</head>

<body>
    <div id="map"></div>
    <script>
        var mapOptions = {

            center: [39.385044, 114.486671],
            zoom: 8
        }

        // Creating a map object
        var map = new L.map('map', mapOptions);
        L.control.scale().addTo(map);

        L.tileLayer('http://tile.thunderforest.com/cycle/{z}/{x}/{y}.png')
            .addTo(map);

        var drawnItems = new L.FeatureGroup();
        map.addLayer(drawnItems);
        var drawControl = new L.Control.Draw({

            position: 'topright',
            edit: {

                featureGroup: drawnItems
            }
        });
        map.addControl(drawControl);
        map.on(L.Draw.Event.CREATED, function (event) {

            var layer = event.layer;

            drawnItems.addLayer(layer);
        });
    </script>
</body>

</html>
4.10 实现侧栏功能
使用了第三方库的代码,如下:
https://github.com/Turbo87/sidebar-v2
<!DOCTYPE html>
<html lang="en">
<head>
    <title>sidebar-v2 example</title>

    <meta name="viewport" content="width=device-width, initial-scale=1.0, maximum-scale=1.0, user-scalable=no">
    <meta charset="utf-8">

    <link href="https://maxcdn.bootstrapcdn.com/font-awesome/4.1.0/css/font-awesome.min.css" rel="stylesheet">
    <link rel="stylesheet" href="https://unpkg.com/[email protected]/dist/leaflet.css" />
    <!--[if lte IE 8]><link rel="stylesheet" href="https://cdn.leafletjs.com/leaflet-0.7.2/leaflet.ie.css" /><![endif]-->

    <link rel="stylesheet" href="sidebar-v2/css/leaflet-sidebar.css" />

    <style>
        body {

            padding: 0;
            margin: 0;
        }

        html, body, #map {

            height: 100%;
            font: 10pt "Helvetica Neue", Arial, Helvetica, sans-serif;
        }

        .lorem {

            font-style: italic;
            color: #AAA;
        }
    </style>
</head>
<body>
    <div id="sidebar" class="sidebar collapsed">
        <!-- Nav tabs -->
        <div class="sidebar-tabs">
            <ul role="tablist">
                <li><a href="#home" role="tab"><i class="fa fa-bars"></i></a></li>
                <li><a href="#profile" role="tab"><i class="fa fa-user"></i></a></li>
                <li class="disabled"><a href="#messages" role="tab"><i class="fa fa-envelope"></i></a></li>
                <li><a href="https://github.com/Turbo87/sidebar-v2" role="tab" target="_blank"><i class="fa fa-github"></i></a></li>
            </ul>

            <ul role="tablist">
                <li><a href="#settings" role="tab"><i class="fa fa-gear"></i></a></li>
            </ul>
        </div>

        <!-- Tab panes -->
        <div class="sidebar-content">
            <div class="sidebar-pane" id="home">
                <h1 class="sidebar-header">
                    sidebar-v2
                    <span class="sidebar-close"><i class="fa fa-caret-left"></i></span>
                </h1>

                <p>A responsive sidebar for mapping libraries like <a href="http://leafletjs.com/">Leaflet</a> or <a href="http://openlayers.org/">OpenLayers</a>.</p>

                <p class="lorem">hello tom</p>
                <p class="lorem">hello jack</p>
                <p class="lorem">hello lingling</p>
                <p class="lorem">hello kitty</p>
            </div>

            <div class="sidebar-pane" id="profile">
                <h1 class="sidebar-header">Profile<span class="sidebar-close"><i class="fa fa-caret-left"></i></span></h1>
            </div>

            <div class="sidebar-pane" id="messages">
                <h1 class="sidebar-header">Messages<span class="sidebar-close"><i class="fa fa-caret-left"></i></span></h1>
            </div>

            <div class="sidebar-pane" id="settings">
                <h1 class="sidebar-header">Settings<span class="sidebar-close"><i class="fa fa-caret-left"></i></span></h1>
            </div>
        </div>
    </div>

    <div id="map" class="sidebar-map"></div>

    <a href="https://github.com/Turbo87/sidebar-v2/"><img style="position: fixed; top: 0; right: 0; border: 0;" src="https://s3.amazonaws.com/github/ribbons/forkme_right_darkblue_121621.png" alt="Fork me on GitHub"></a>

    <script src="https://unpkg.com/[email protected]/dist/leaflet.js"></script>
    <script src="sidebar-v2/js/leaflet-sidebar.js"></script>

    <script>
        var map = L.map('map');
        map.setView([39,114], 9);

        L.tileLayer('http://tile.thunderforest.com/cycle/{z}/{x}/{y}.png')
            .addTo(map);

        var marker = L.marker([39,114]).addTo(map);

        var sidebar = L.control.sidebar('sidebar').addTo(map);
    </script>
</body>
</html>

结语
如果您觉得该方法或代码有一点点用处,可以给作者点个赞,或打赏杯咖啡;╮( ̄▽ ̄)╭
如果您感觉方法或代码不咋地//(ㄒoㄒ)//,就在评论处留言,作者继续改进;o_O???
如果您需要相关功能的代码定制化开发,可以留言私信作者;(✿◡‿◡)
感谢各位大佬童鞋们的支持!( ´ ▽´ )ノ ( ´ ▽´)っ!!!
智能推荐
Git取消add 、 commit、push的命令_git 取消add-程序员宅基地
文章浏览阅读2w次,点赞284次,收藏328次。撤销已经add,但是没有commit的问题git reset HEAD撤销已经commit,但是没有push到远端的文件(仅撤销commit 保留add操作)git reset --soft HEAD^查看状态查看没有git add的文件git checkout 查看当前提交状态git status......_git 取消add
微机原理知识点汇总-程序员宅基地
文章浏览阅读4.3k次,点赞10次,收藏113次。西南交通大学电气学院电子信息工程专业课----微机原理知识点总结,含部分习题。讨论基于8086/8088的CPU及系统结构,汇编语言基础编程_微机原理
uniapp中Vuex数据持久化_uniapp vuex持久化-程序员宅基地
文章浏览阅读1.8w次,点赞3次,收藏18次。解决H5应用中存在Vuex中的数据在刷新页面后丢失_uniapp vuex持久化
html文件引用.vue 文件的方式_html引入vue-程序员宅基地
文章浏览阅读7k次,点赞4次,收藏24次。1.html文件先引入vue.js再引入httpVueLoader.js注册httpVueLoader。在script中Vue.use(httpVueLoader);在components中注册组件,httpVueLoader的注册方式有好几种,具体引用方式看个人习惯,更多的可以去看httpVueLoader官网:https://www.npmjs.com/package/http-vue-loader;<!DOCTYPE html><html lang="en_html引入vue
CAMERA DTSI信息_高通 cci-程序员宅基地
文章浏览阅读366次。本文介绍camera dtsi配置相关内容。参考平台:qcom sdm660_高通 cci
python内置数据集_在python中内置数据集-程序员宅基地
文章浏览阅读1.2k次。python内置数据集Python modules containing built-in datasets and ways to access them 包含内置数据集的Python模块及其访问方式 Built-in datasets prove to be very useful when it comes to practicing ML algorithms and you are i..._python内置数据集
随便推点
计算机网络体系结构-程序员宅基地
文章浏览阅读825次,点赞27次,收藏18次。计算机网络分层结构,计算机网络协议、接口、服务的概念
韶音、南卡、Oladance开放式耳机值得买吗?多维度测评实力最强品牌-程序员宅基地
文章浏览阅读846次,点赞18次,收藏12次。作为一名热爱音乐的资深用户,我体验过众多品牌的开放式耳机,希望通过我的评测,能够帮助大家找到最适合自己的耳机。不过,在中高频方面,耳机的表现略显刺耳,音质和音量可能不尽如人意,这可能会对用户的整体听觉体验产生一定影响。不过,延迟性相对较高,对于需要实时音视频同步的场景,如追剧或游戏,可能不太适合,存在明显的延迟问题。然而,在使用这项技术的耳机时,尤其是在游戏过程中,可能会遇到较高的延迟问题,这可能导致音画不同步的现象更加明显。然而,在剧烈运动时,耳机的稳固性可能需要加强,以避免因动作过大而导致脱落。
bert简介_tensorflow 2.0+ 基于BERT的多标签文本分类-程序员宅基地
文章浏览阅读3.8k次,点赞6次,收藏24次。在多标签分类的问题中,模型的训练集由实例组成,每个实例可以被分配多个类别,表示为一组目标标签,最终任务是准确预测测试数据的标签集。例如:文本可以同时涉及宗教、政治、金融或教育,也可以不属于其中任何一个。电影按其抽象内容可分为动作片、喜剧片和浪漫片。电影有可能属于多种类型,比如周星驰的《大话西游》,同时属于浪漫片与喜剧片。多标签和多分类有什么区别?在多分类中,每个样本被分配到一个且只有一个标签:水果..._tensorflow bert
jupyter notebook常用快捷键和语法_jupyter notebook怎么换行-程序员宅基地
文章浏览阅读6.1k次,点赞4次,收藏29次。jupyter notebook 常用快捷键及编辑语法jupyter 单元格有两种模式:命令模式(蓝色标签)和编辑模式(绿色标签)。点击单元格外可进入命令模式,点击单元格内进入编辑模式。编辑模式又分为code模式(单元格外有 ‘In [ ]’)即写代码模式和markdown模式(无‘In [ ]’)即写文档模式。一、快捷键根据jupyter单元格所处模式不同,快捷键可分为两类:具体可在jupyter文件编辑界面的‘HELP’选项中查看,这里列出本人认为较为常用的几个。命令模式下的快捷键:_jupyter notebook怎么换行
教材编者,请多点儿“钻研”精神-程序员宅基地
文章浏览阅读89次。教材编者,请多点儿“钻研”精神——《计算机程序设计艺术》一书带来的启示 苏运霖 《计算机程序设计艺术》这本关于算法分析的多卷论著已长期被公认为经典计算机科学的定义性描述。近期在翻译该书的第1卷第1版的过程中,我深刻体会到国外作者在教材编写上的“执着”,主要表现在以下三方面: 一是勤于创新。该书作者Donald E. Knuth曾开拓了以多卷书的形式来系统介绍“计算机程序设计艺术”的创举,现在又以分..._教材编写中编者主要贡献有哪些
MySQL如何更改数据库名字_mysql update数据库名称-程序员宅基地
文章浏览阅读3.9k次。MySQL如何更改数据库名字_mysql update数据库名称